Tag Archives: service quality management

Service Assurance’s Future with Machine Learning

Thanks again for all the great feedback on this blog series. I want to continue the ongoing discussion by guessing service assurance’s future with machine learning. There are infinite operational problems out their for providers and IT. Machine learning offers an inexpensive, yet expansive flexible way to solve problems. Here are some of the most extreme ideas I have thought of to common problems of the industry. If you have heard anyone tackle these with machine learning I would love to hear more about it.

“We Hate Rules” — Says Everyone

Service Assurance's Future with Machine Learning
One common compliant I have heard from customers and partners as long as I have been in business is around rules. “We hate rules!” I don’t like rules by the problem this technology solves is a big one. How do I decrypt vital fault details in a variety of different ways into operational actionable events? Right now people have compilers to take SNMP MIBs and export them into rules of some sort. From HPOV to IBM Netcool to open-source MRTG – its the same solution. What if?  Is it possible to apply machine learning? What if automation enriches faults and decides which KPIs are important? Google is a great source of truth. Consider deconstruction of the MIB into OIDs and google it. Based upon parsing the search results you may consider its worth of collection or not. Then, let’s use some of the solution we discussed already – fault storms and reduction. We can bubble up anomalies and chronics with zero human touch. How accurate it could it be? This should be surprising. You could always have an organic gamification engine to curate. Think about it from a possible results. No rules, No human touch, No integration costs, only ramp time. An interesting idea.

Are We Really Impacting the Customer?

Service Assurance's Future with Machine Learning
 
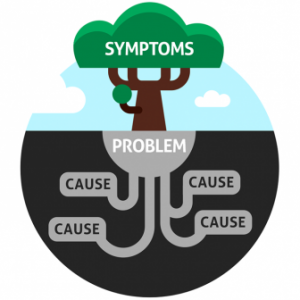
I know we have all heard this one before. Service impact. How do you know if a fault is service impacting or not? If you notify a customer they are down and they are not – they lower their opinion of you. Flip it around they hate you. Understanding impact is a common problem. Common industry practice is leverage a common event type category – think trap OID name. The problem is that it over simplifies it and their is a lot of guess work in those rules (see above). What if they fault is on a lab environment?  Is there no traffic on that interface? What if its redundancy is active or failed? Too much complexity. This is machine learning’s sweet spot. Imagine a backfill from ticketing to show that the customer confirms there was an impact. Than linking that data pool to the model of faults. Where you can compare that model to a current situation to score a likelihood of impact. That way you are using a solid source of truth, the customer, to define the model. — UPDATE — It’s true you could use network probes and they could scan the data to ensure the service is being used. Pretty expensive solution IMHO, buying two probes for every network service. It would be cheaper to use Cisco IPSLA/Juniper RPM or Rping MIB.

Which KPI is Important?

Service Assurance's Future with Machine Learning
 
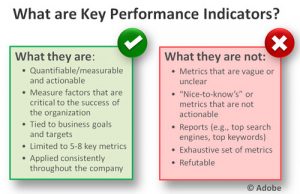
Last idea I have seen is around service quality management. In service management, customers complain about templates and models need to be pre-defined. Typical SLAs do not have the detail required to support a technology model to track them. The research required to determine the performance metrics that drive takes too much time and effort. With machine learning and public algorithms like “Granger causality” a new possible emerges. The service manager can identify and maintain the model — whatever the product offered. How could it work? My thought is simple using root-level metrics – availability, latency, bandwidth to provide baseline. All other vendor OIDs or custom KPIs available can be collected and stored. With machine learning, you can develop the models for each root metric and each custom metric. Using artificial intelligence, you can identify which custom metrics predict the degradation of a root one. So those are the metrics you want to poll more frequently, have higher priority, and power service quality metrics. The result would be fewer high frequency polling. Then more meaningful prediction for service quality management.
 
 
Let me know your thoughts. These are some of the crazier ideas I have seen/heard, but I am sure you have heard of others.
Service Assurance's Future with Machine Learning

About the Author

Serial entrepreneur and operations subject matter expert who likes to help customers and partners achieve solutions that solve critical problems.   Experience in traditional telecom, ITIL enterprise, global manage service providers, and datacenter hosting providers.   Expertise in optical DWDM, MPLS networks, MEF Ethernet, COTS applications, custom applications, SDDC virtualized, and SDN/NFV virtualized infrastructure.  Based out of Dallas, Texas US area and currently working for one of his founded companies – Monolith Software.

Understanding Service Assurance Correlation & Analytics

Data is good right?   The more data the better.   In fact, there is a whole segment of IT related to data call BIG data analytics.   Operations have data, tons of it.    Every technology devices spits out gigabytes of data a day.   The question is figuring out how to filter data. It’s all about reducing that real-time stream of data into actionable information.   Understanding service assurance correlation & analytics is all about focusing operations. That attention can produce that better business results.   This blog details common concepts and what’s available in the marketplace. I want show the value of driving data analytics into actionable information. Value operations can execute successfully.

Maturity Curve for Service Assurance Correlation & Analytics

Let’s talk about terminology first.    Correlation versus analytics is an interest subject.   Most people I talk to, consider correlation to be only within fault management.    Analytics includes TimeSeries data like performance and logs.   Now I know some would disagree with that simplification, we can use it here to avoid confusion.   Whether it be either term, what we look for is reduction and simplification.   The more actionable your information is, the quicker you can resolve problems.

Visual Service Assurance Correlation & Analytics

Visual Correlation & Analytics

First step on the road to service assurance correlation and analytics is enabling a visual way to correlate data.   Correlation is not possible if the data is missing, so have unified collection is your first step.    Once you have the data co-located you can drive operations activities to resolution.    Technicians can leverage the tool to find the cause of the fault.   Drill-down tools can help uncover enough information.  Then the NOC techs can perform manual parent/child correlation.   

Once executed, users of the assurance tool can also suppress, or hide, faults.   Faults that are not impacting or known false errors become sorted out as “noise”.    Assurance systems then leverage third party data to enrich faults.   Enrichment would allow faults to include more actionable data. This makes them easier to troubleshoot.    All these concepts should be second nature.   Operations should have all these visual features as part of the assurance. Otherwise they are hamstrung.

Basic Service Assurance Correlation & Analytics

Basic Correlation & Analytics

Once you have a tool that has all your data, you will be swimming in the quantity of that data.    You must reduce that data stream.   If not, you will overload the NOC looking at the stack instead of the needle.   There are many basic level strategies that allow that reduction.

First, look at de-duplication.   This feature allows you to match up repeat faults and data points. Which eliminates 80% of duplicate data.   Matching “up” to “down” messages allow elimination of 50% of your data stream.    Reaping jobs can close out data that are not deemed “current” or limited log data.    Another common feature is suppressing faults. Suppression by time windows during scheduled maintenance or excluding business hours.    Threshold policies can listen to “noise” data and after X times in Y minutes create an alert.    These features should be available on any assurance platform. If yours lacks them, look to augment.

RCA Service Assurance Correlation & Analytics

Root Cause Analysis Correlation & Analytics

If you have a NOC with thousands of devices or tens of domains, you need cross domain correlation.   Root cause analysis is key to reducing complexity of large access networks.   Performing RCA across many technology domains is a core strategy. Operations can use it for consolidated network operations. Instead of playing the blame game, you know which layer is at fault.   Leveraging topology to sift through faults is common. Unfortunately its not typical in operations.   Topology data can sometimes be difficult to collect or of poor quality.   Operations needs a strong discovery strategy to prevent this.

Cluster-based Correlation

Cluster-based correlation is another RCA strategy. This one does not rely upon topology data.   The concept here is using trained or machine learning data. A written profile will align data when a certain pattern matched.  The tools create patterns during troubleshooting process. Others have algorithms that align faults with time and alerts.   Once the pattern matches, the alert fires causing a roll-up by the symptoms to reduce the event stream.    This correlation method is popular, but hasn’t provided much results yet. Algorithms are the key here. Many challenge its ROI model that requires machine training.

Customer Experience Assurance

Next, RCA enables operations to become more customer-centric.   Service oriented correlation allows operations to see the quality of their network. All through their customers eyes.   Some call this functionality “service impact analysis”. I like the term “customer experience assurance”.   Understanding what faults are impacting customers and their services enables higher efficient operations.   The holy grail of operations is focusing on only root causes. Then prioritize action only by customer value.

Service Quality Management

Lastly, you can track customer temperature by moving beyond outages and into quality.   Its important to under the KPIs of the service. This allows clarity on how well the service is performing. If you group these together, you simplify.  While operations ignore bumps and blips, you still need to track them.    Its important to understand those blips are cumulative in the customers eyes.   If the quality threshold violates, customers patience will be limited. Operations needs to know the temperature of the customer.   Having service and customer level insights are important to provide high quality service. Having a feature like this drives better customer outcomes.

Cognative Service Assurance Correlation & Analytics

Cognitive Correlation & Analytics

The nirvana of correlation and analytics includes a cognitive approach.   Its a simple concept. The platform listens, learns, and applies filtering and alerting.    The practice is very hard.   Most algorithms available diverse. They are either domain specific (website log tracking) or generic in nature (holtz-winter).    Solutions need to be engineered to apply the algorithms only where they make sense.

Holtz-Winter Use Case

One key use case is IPSLA WAN link monitoring.  Latency across links must be consistent.  If you see a jump, that anomaly may matter.   The Holtz-Winter algorithm is for tracking abnormal behavior through seasonal smoothing.   Applied to this use case, an alert is raise when the latency breaks its normal operation.    This allows operations to avoid setting arbitrary threshold levels.   Applying smart threshold alerting can reduce operational workload.   Holtz-winter shows how cognitive analytics can drive better business results.

Adaptive Filtering Use Case

Under the basic correlation area I listed dynamic filtering.   A fault can happen “X times in Y minutes”. If so, create alert Z.    This generic policy is helpful. The more you use it, you will realize that you need something smarter.   Adaptive filtering using cognitive algorithms allows for a more comprehensive solution.   While the X-Y-Z example depends upon two variables, the adaptive algorithm leverages hundreds.    How about understanding whether the device is in a lab or a core router?   Does the fault occurs ever day at the same time?   Does it proceeds a hard failure.   

You can leverage all these variables to create an adaptive score.   This score would be an operational temperature gauge or noise level.   NOC techs can cut noise during outages. They can increase it during quiet times or sort by it to understand “what’s hot”.    Adaptive filtering enables operations the ability to slice and dice their real-time fault feeds. This feature is a true force multiplier.

The Value of Correlation & Analytics

Understand the Value in Service Assurance Correlation & Analytics

The important part of correlation & analytics with service assurance is its value. You must understand what is freely available and it’s value to operations.    This subject varies greatly from customer to customer and environment to environment.   You have to decide how far the rabbit hole you want to go.    Always ask the question “Hows does that help us”.    If you are not moving the needle, put it on the back burner.   

If you are not saving 4-8 hours of weekly effort a week for the policy, its just not work the development effort.    Find your quick wins first.     Keep a list in a system like Jira and track your backlog.   You may want to leverage a agile methodology like DevOps if you want to get serious.   Correlation and analytics are force multipliers.   They allow operations to be smarter and act more efficiently.   These are worthwhile pursuits, but make sure to practice restraint.   Focus on the achievable, you don’t need to re-invent the wheel.   Tools are out there that provide all these features.   The question to focus on is “Is it worth my time?”.

Shawn Ennis

About the Author

Serial entrepreneur and operations subject matter expert who likes to help customers and partners achieve solutions that solve critical problems.   Experience in traditional telecom, ITIL enterprise, global manage service providers, and datacenter hosting providers.   Expertise in optical DWDM, MPLS networks, MEF Ethernet, COTS applications, custom applications, SDDC virtualized, and SDN/NFV virtualized infrastructure.  Based out of Dallas, Texas US area and currently working for one of his founded companies – Monolith Software.